Meet Keryx, the successor to Actionhero — a TypeScript framework on Bun that serves one action class over HTTP, WebSockets, the CLI, background tasks, and as an MCP tool for AI agents. keryxjs.com →

Repl-and-debugging
Debugging and REPL
Debugging
Development Debugging / Typescript Debugging
Actionhero makes it simple to use the node.js debugger, even when developing your project with Typescript. New Actionhero projects comes with a npm run debug script which will pass the proper arguments to ts-node-dev, which we use to run our development mode server. For older Actionhero projects, to start a debugger with ts-node-dev, the command is:
tsc && ts-node-dev --transpile-only --no-deps --inspect -- ./src/serverOnce your server is running in debug mode, you can then attach to it via a number of debuggers. The default debugger in Chrome can be used. Learn more here: https://nodejs.org/en/docs/guides/debugging-getting-started/.
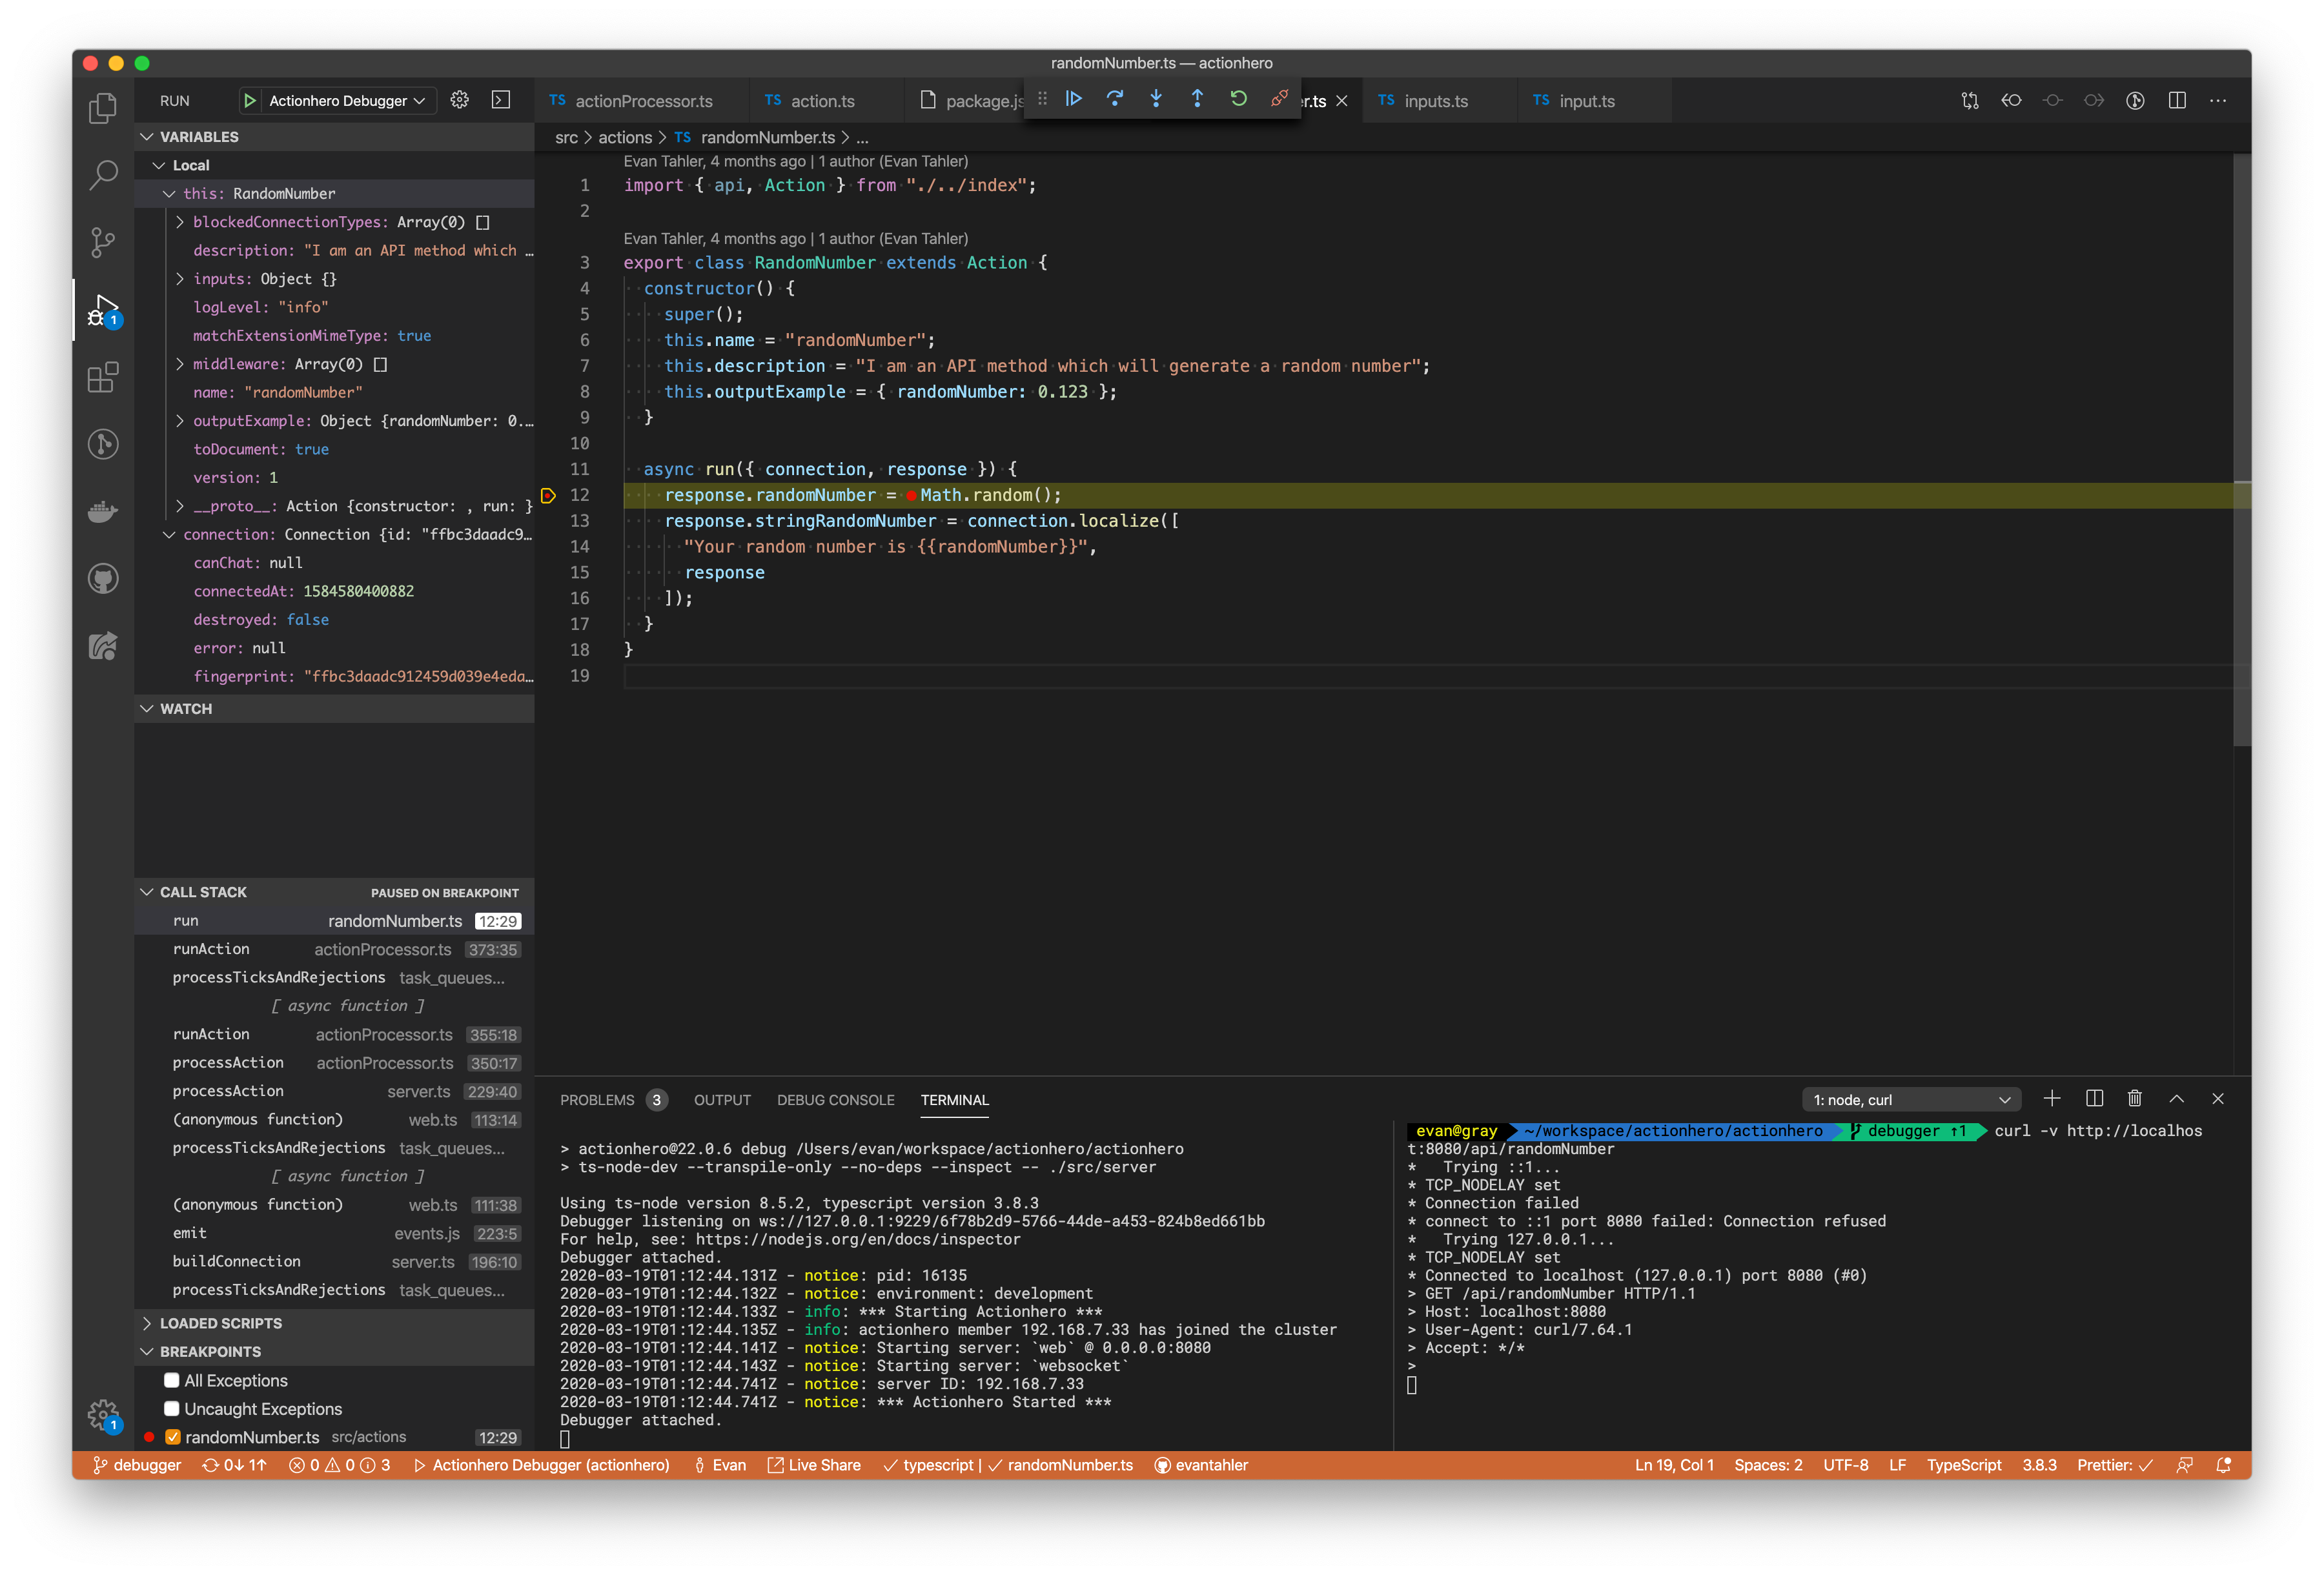
You can also use the inspector built into your IDE. For example, VSCode is easy to use with the following .vscode/launch.json configuration. This example includes 2 ways to use the debugger: You can attach to an existing Actionhero process which was launched with npm run debug with Actionhero Debugger (attach), or you can have VSCode compile your Typescript and attach the debugger all at once (Actionhero Debugger (launch))
// from .vscode/launch.json

{
  "version": "0.2.0",
  "configurations": [
    {
      "type": "node",
      "request": "attach",
      "name": "Actionhero Debugger (attach)",
      "protocol": "inspector",
      "port": 9229,
      "restart": true,
      "localRoot": "${workspaceFolder}",
      "outFiles": ["${workspaceRoot}/dist/**/*.js"],
      "sourceMaps": true,
      "remoteRoot": "."
    },

    {
      "type": "node",
      "request": "launch",
      "name": "Actionhero Debugger (launch)",
      "program": "${workspaceFolder}/src/server.ts",
      "preLaunchTask": "tsc: build - tsconfig.json",
      "outFiles": ["${workspaceFolder}/dist/**/*.js"],
      "outputCapture": "std"
    }
  ]
}
Caveats:
Since we are using Typescript, there's not going to be a perfect 1-to-1 mapping with the TS and JS files. Both ways of using the debugger above has issues:
- Using the debug console to access imported/required files may have imported names that have been changed. For example,
import { api } from "actionhero";may becomeconst actionhero_1 = require("actionhero");and so to accessapiin the debugger you may need to doactionhero_1.api - Line numbers between JS and TS will change.
- When using the network attach method (
Actionhero Debugger (attach)), the debugger will open the JS files rather than the TS files (although it does a good job of finding the proper line number). - When using the network debugger, you will need first compile your typescript to javascript, including sourcemap files. To combine this with launching actionhero with
ts-node-dev, a debug command in yourpackage.jsonshould be:"debug": "tsc && ts-node-dev --transpile-only --no-deps --inspect -- ./src/server". And be sure yourtsconfig.jsonincludes"sourceMap": true.
Production Debugging
Modern versions of node.js have built-in inspector capabilities.
Run Actionhero with node's --inspect flag, ie: node ./dist/server.js --inspect start
More info about the node inspector can be found on the official node.js website.
REPL
actionhero console

Running "console" task
2015-11-14 17:48:01 - notice: *** starting actionhero ***
2015-11-14 17:48:01 - info: actionhero member 10.0.1.15 has joined the cluster
2015-11-14 17:48:01 - notice: pid: 38464
2015-11-14 17:48:01 - notice: server ID: 10.0.1.15
2015-11-14 17:48:01 - info: ensuring the existence of the chatRoom: defaultRoom
2015-11-14 17:48:01 - info: ensuring the existence of the chatRoom: anotherRoom
2015-11-14 17:48:01 - notice: environment: development
2015-11-14 17:48:01 - notice: *** Server Started @ 2015-11-14 17:48:01 ***
[ AH::development ] > api.id
‘10.0.1.15'

[ AH::development ] > Object.keys(api.actions.actions)
[ ‘cacheTest',
‘randomNumber',
‘swagger',
‘sleepTest',
‘status' ]
Actionhero has a command-line interface called a REPL! This means you can spin up a new instance of Actionhero and manually call all the methods on the api namespace. This combined with the new RPC tools make this a powerful debugging and development tool. Running actionhero console will load up a version of Actionhero in your terminal where you have access to the api object. This version of the server will boot, initialize, and start, but will skip booting any servers. You will be connected to any databases per your initializers.
The REPL will:
- source
NODE_ENVproperly to load the config - will connect to redis and load any user-defined initializers
- will load any plugins
- will not boot any servers
If you are familiar with rails, this is very similar to rails console
Solutions
Actionhero was built from the ground up to include all the features you expect from a modern API framework.
Open Source
The Actionhero server is open source, under the Apache-2 license
Actionhero runs on Linux, OS X, and Windows
You always have access to the Actionhero team via Slack and Github

Premium Training & Review
We provide support for corporate & nonprofit customers starting at a flat rate of $200/hr. Our services include:
- Remote training for your team
- Code Reviews
- Best Practices Audits
- Custom plugin & Feature Development
We have packages appropriate for all company sizes. Contact us to learn more.
Premium Training & Review
We provide support for corporate & nonprofit customers starting at a flat rate of $200/hr. Our services include:
- Remote training for your team
- Code Reviews
- Best Practices Workshops
- Custom plugin & Feature Development
We have packages appropriate for all company sizes. Contact us to learn more.
Enterprise
For larger customers in need of a support contract, we offer an enterprise plan including everything in the Premium plan plus:
- 24/7 access to core members of the Actionhero Team
- Emergency response packages
- Deployment support
- ...and custom development against Actionhero’s core as needed.